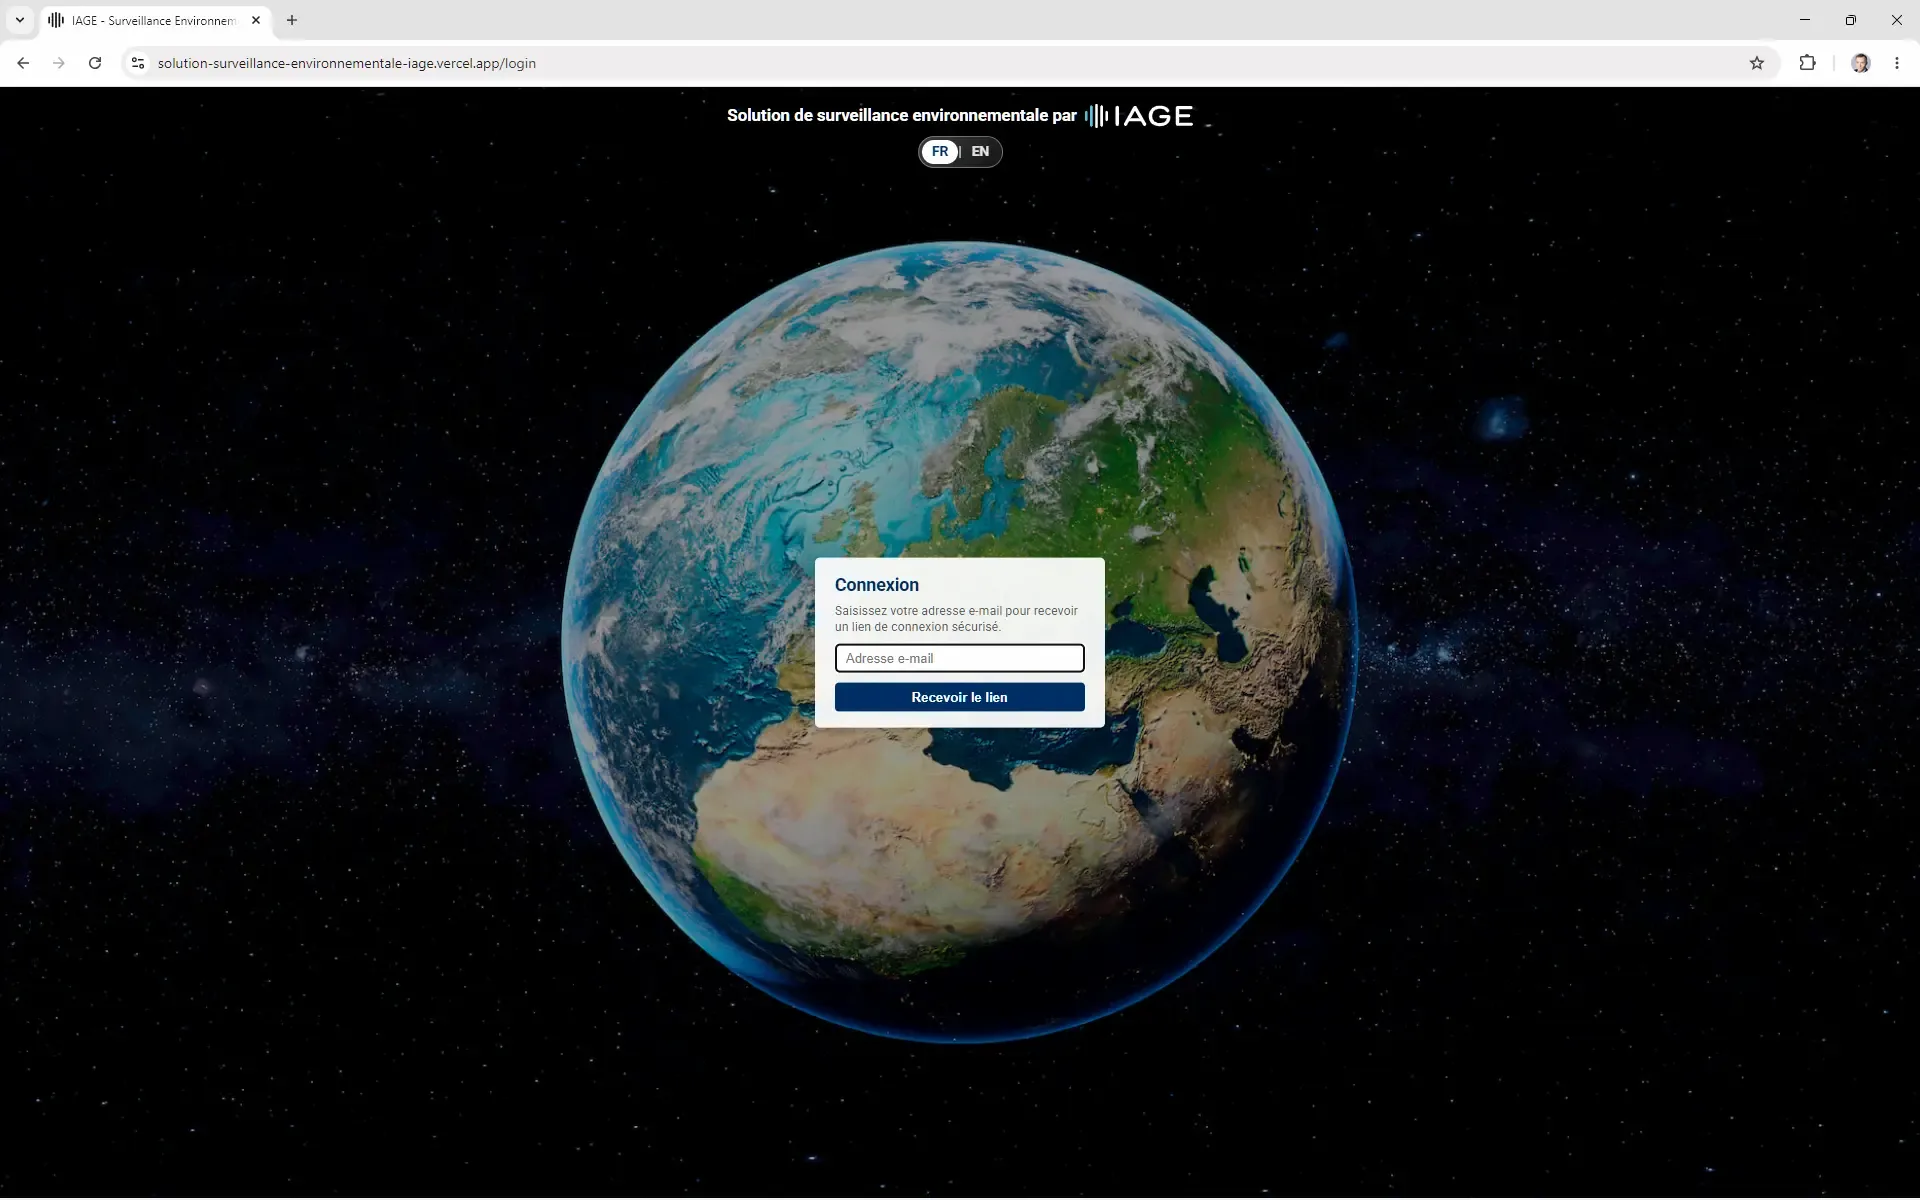
Environmental monitoring solution by IAGE
Industry-specific monitoring and alerts
For professionals, IAGE has added a secure online portal to its range of consultancy and monitoring services:
- monitor all your sites and results;
- view at a glance the status and trends over time of the biological parameters relevant to your industry.
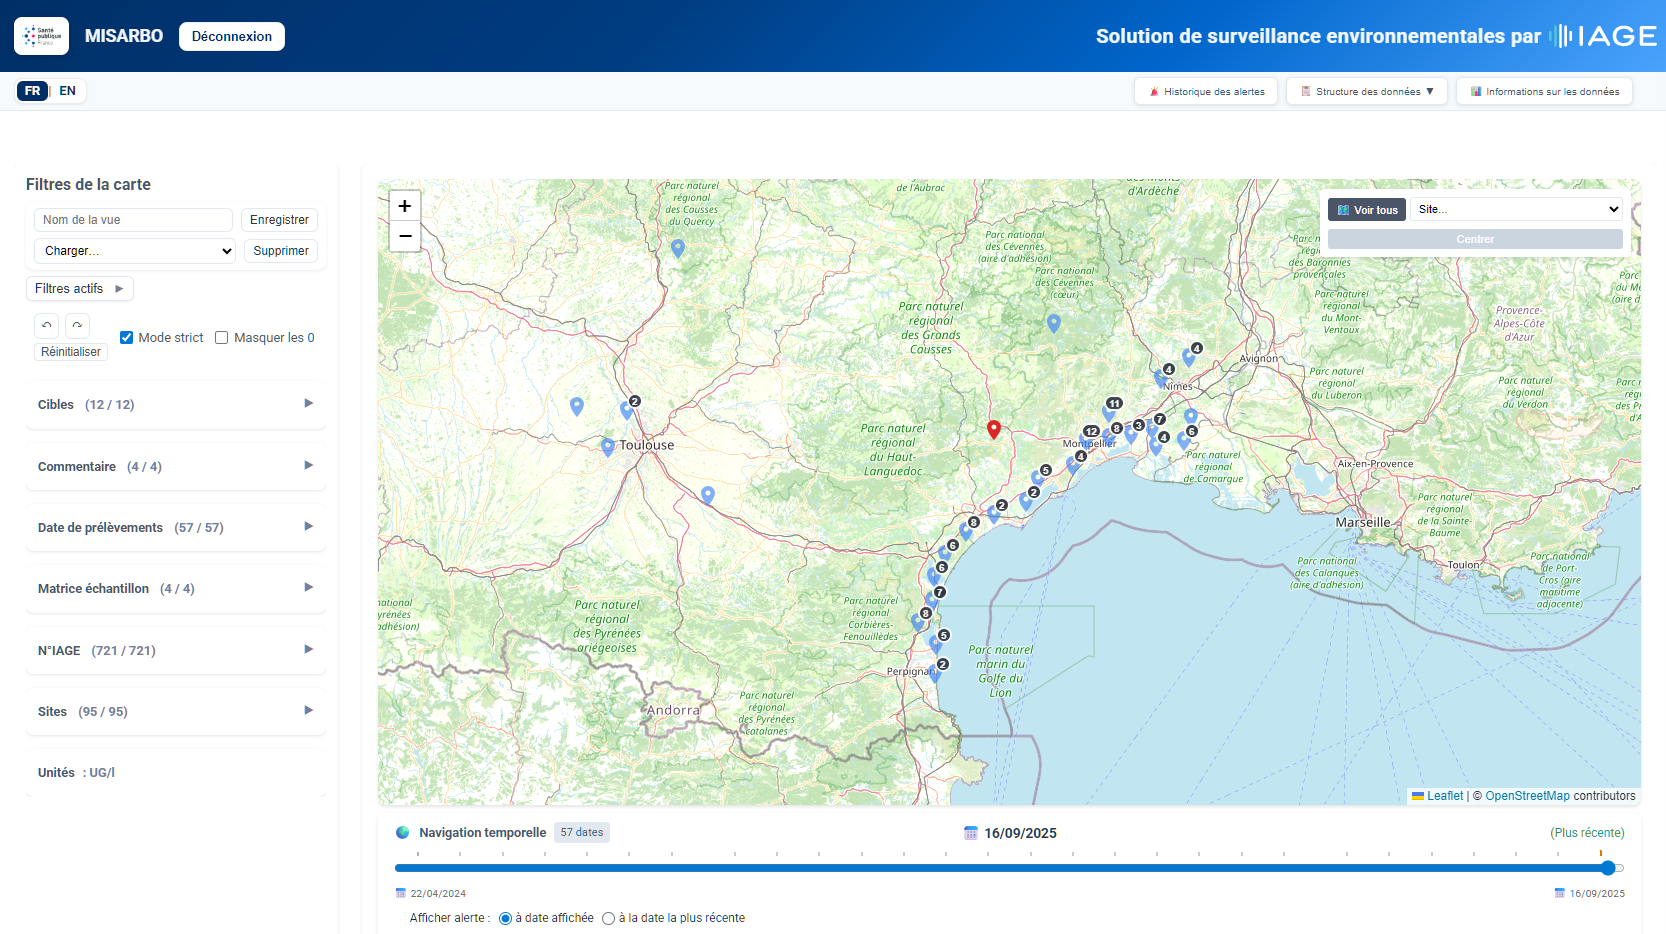
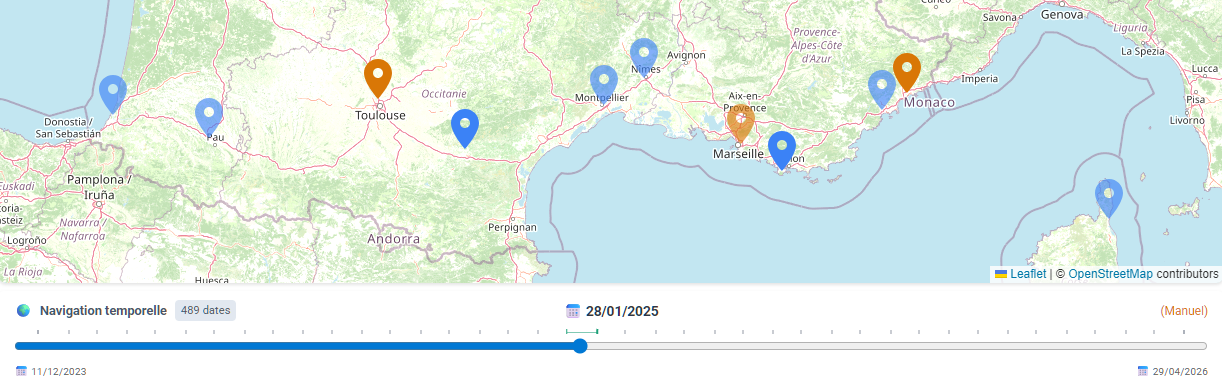
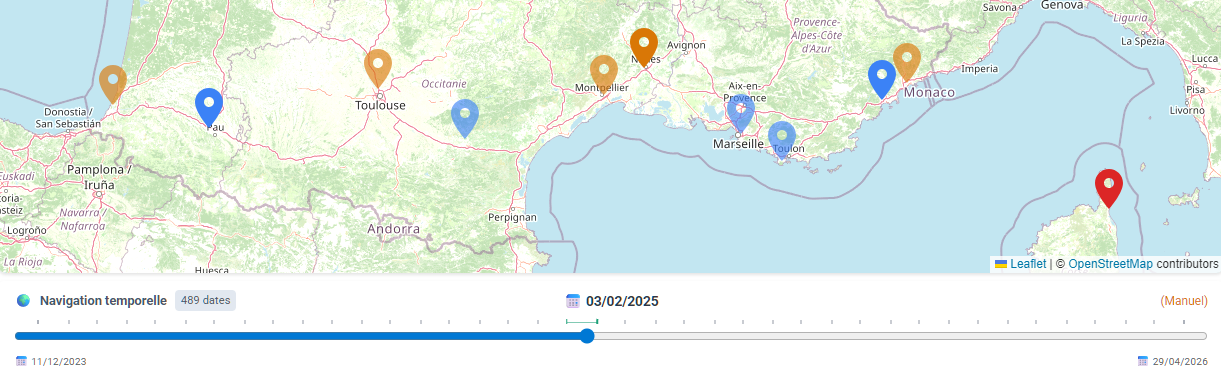
The map: view alerts spatially, scroll back in time
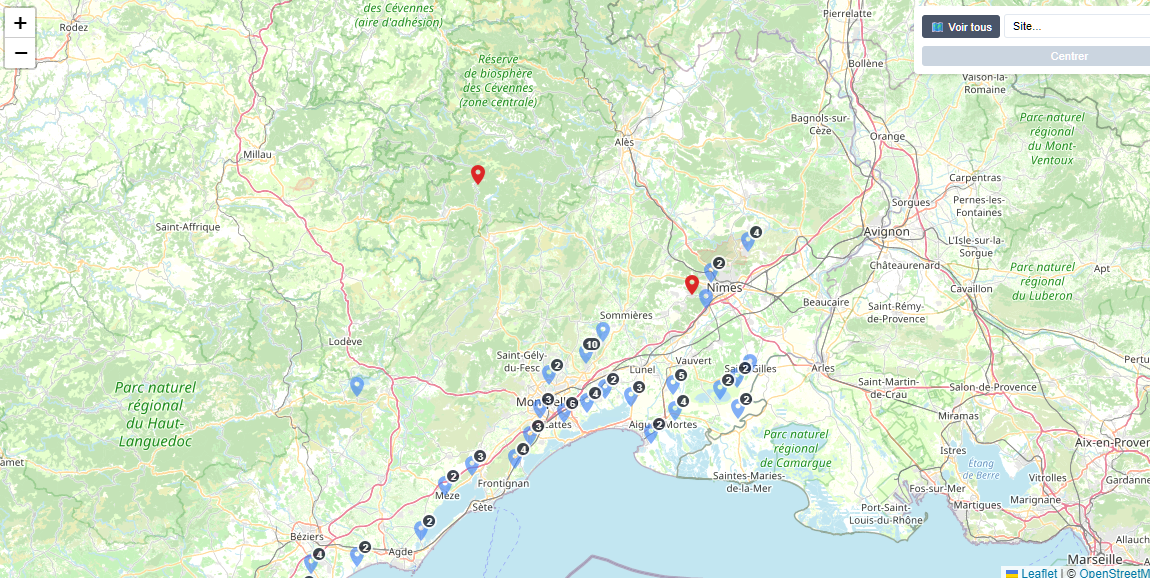
1) The map allows you to identify immediately the site(s) to be placed under monitoring (orange) or that have reached an alert level (red), based on the latest measurement results.
--> You can quickly assess the situation and react faster and more effectively.
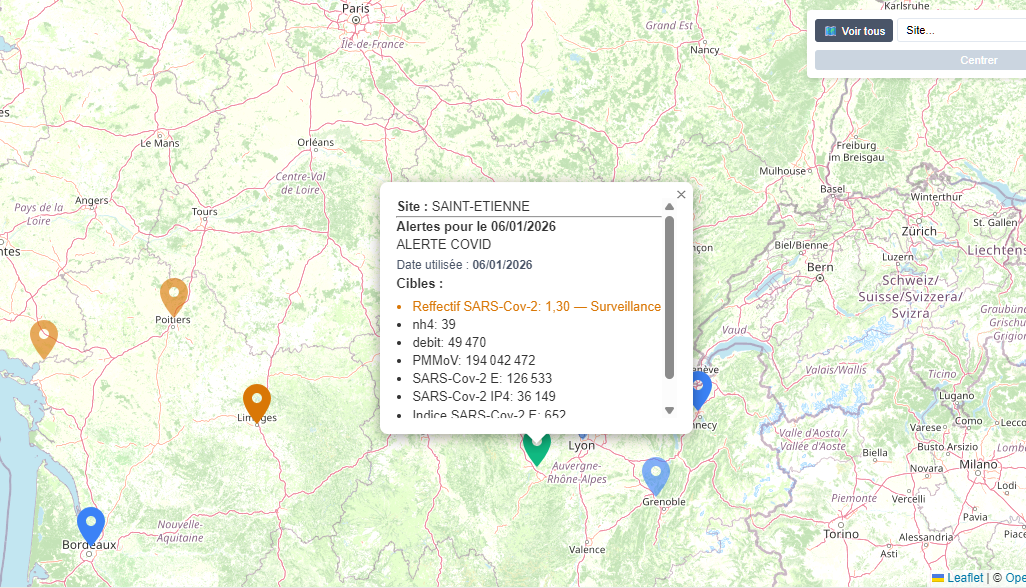
2) With a single click, you can view the results and what is causing the alert.
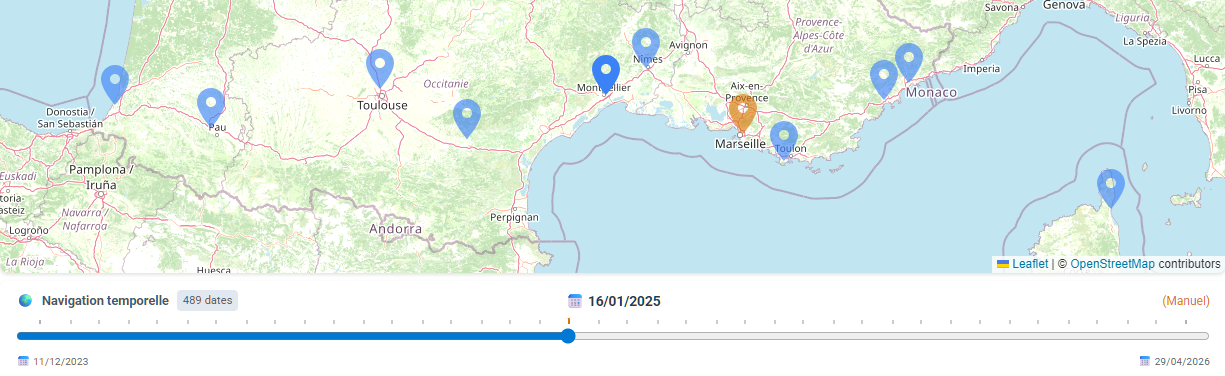
3) The scrollable ‘TIMELINE’ allows you to view how alerts have evolved over time with a simple swipe of the mouse – or thumb.
--> You can better understand trends over time and act when appropriate.
Graphs: visualising trends over time
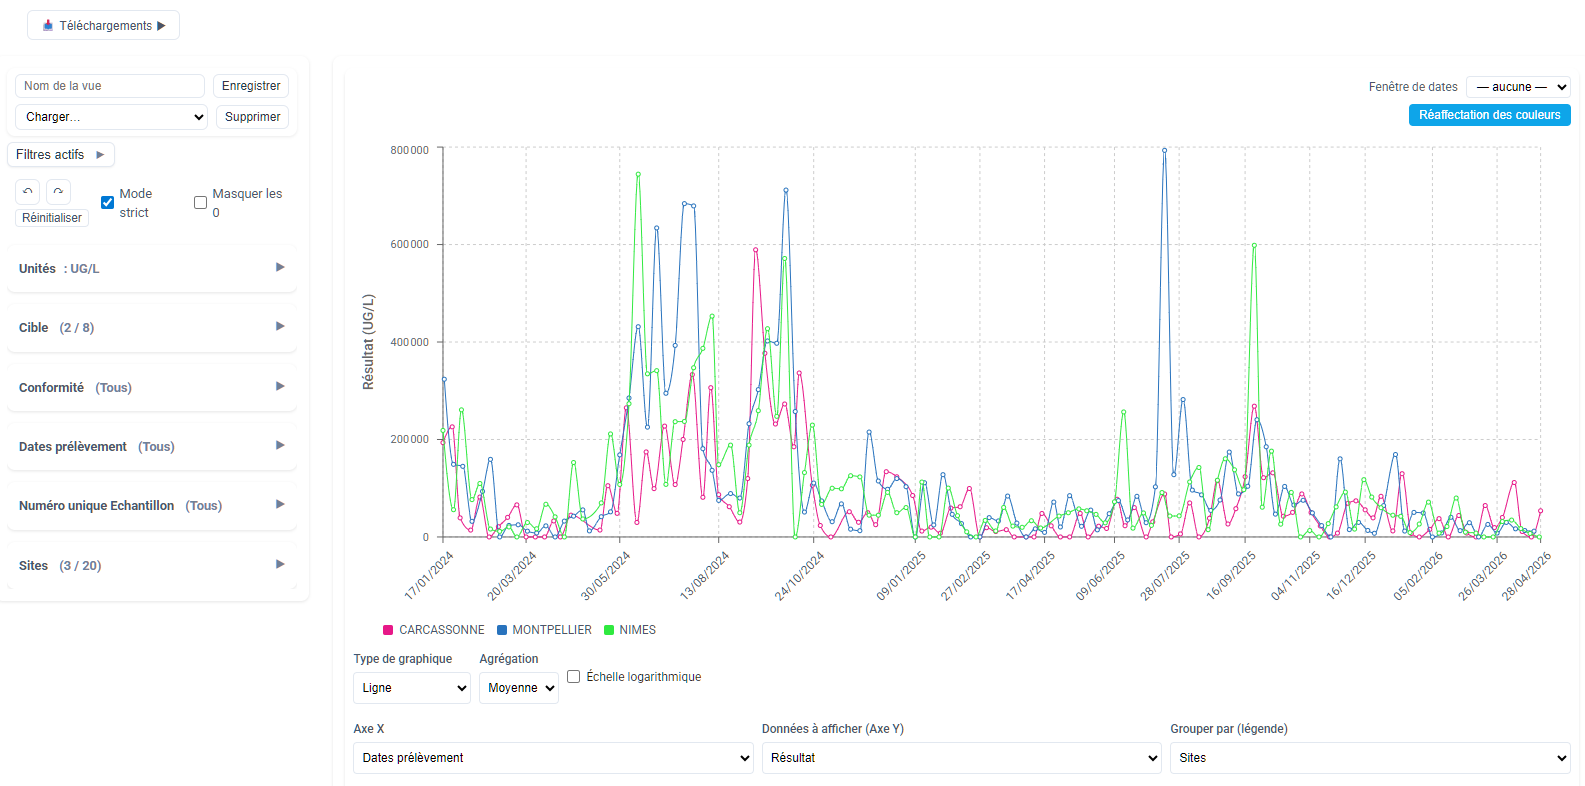
Graphical displays allow you to assess trends over time at a glance, compare sites with one another, or compare trends for different pathogens.
--> You can better understand what is happening or compare sites to take appropriate action.
--> You can filter by the categories you have selected
Configure your Monitoring Solution
When setting up your Monitoring Solution, you work with us to define the filters you require, including additional information relating to sampling sites; for example, the region or county of the sampling sites, the type of sampling sites, or groupings of sites relevant to your business;
You can add contextual information that you send us with the samples (e.g. flow rates, temperatures, etc.) and which you will see in the displays.
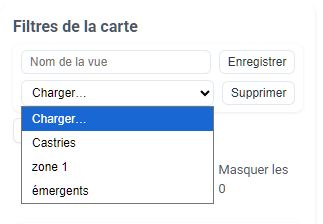
Choose topics of interest and displayed elements
Filters allow you to select only the information that matters to you. For example, a single site or a few sites from among those being monitored; or a specific pathogen or indicator: a view can be saved to be loaded automatically the next time you log in.
You can chose one selection on your desktop computer and another on your mobile.
Want to go further in analysing and utilising the results?
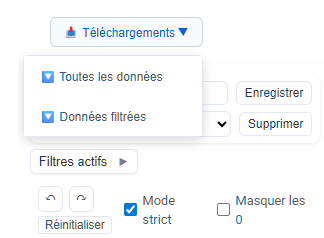
Download all your data, or the filtered data, to analyse the results in greater depth.
IAGE experts of your sector and modelling experts can also assist you in utilising your data.
Or contact us for a demonstration :
GET IN TOUCH